Whether for locating a boat, planning a route, assessing depths, identifying hazards, knowing tides and currents or finding your way around the coast, chart references are a universal language for sailors.
Altitude
France’s general levelling datum, defined by IGN.
Depth
Chart datum, corresponding to the water level at the lowest possible tide.
Contact
The WGS 84 system, used by GPS.
The symbols
They represent various elements such as hazards, restricted areas, ports, etc.
Highlights
Lighthouses, buoys, beacons, landmarks, etc., that serve as visual landmarks
Isobathic lines
These lines connect points of the same depth, making it possible to visualize underwater relief.
Ladders
They indicate the relationship between the distance on the map and the actual distance in the field.
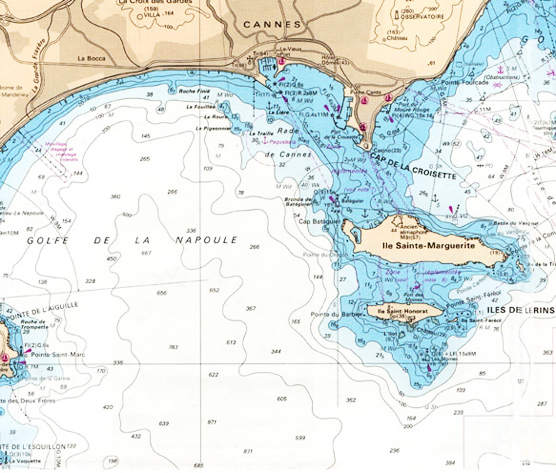
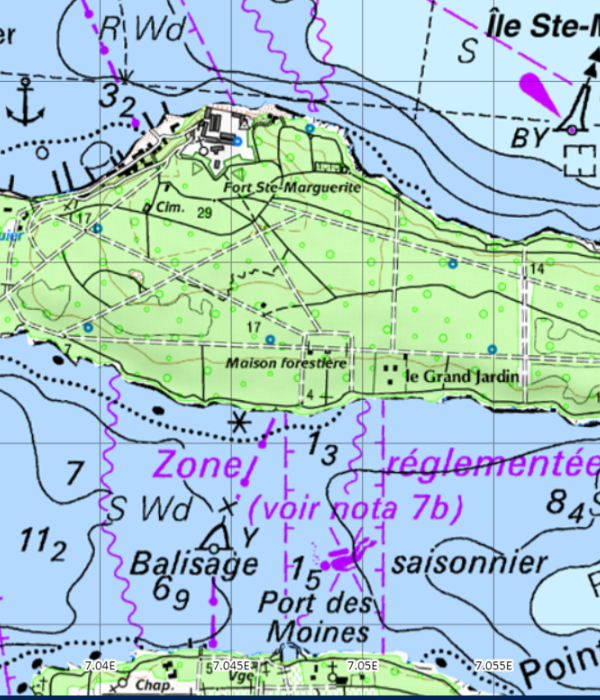
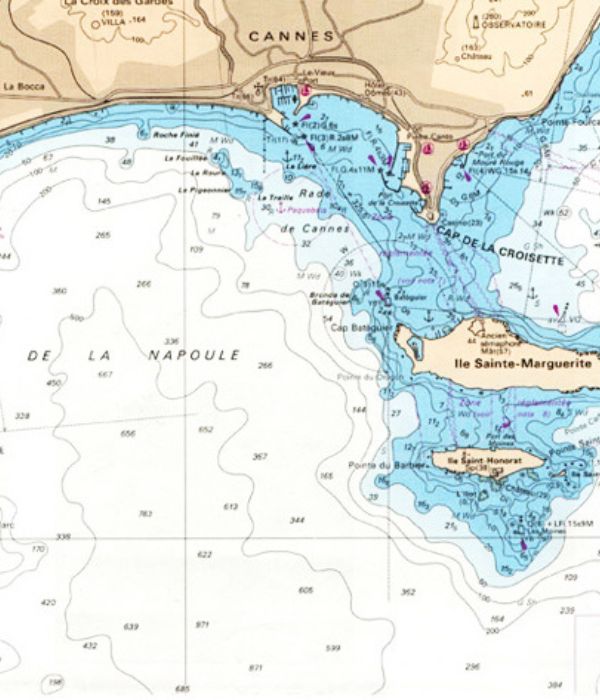
Colors and their meanings
White: Deep depths.
Blue :Shallow depths (0 to 10 m). The darker the blue, the less water.
Green : Foreshore (strip of coast covered at high tide and uncovered at low tide)
Bistre :Emerging land.
Rose : Lighthouses, underwater cables, restricted areas.
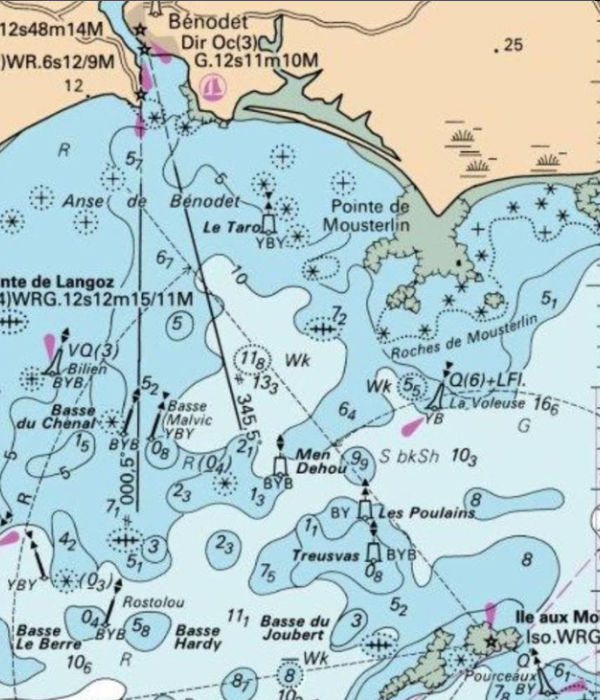
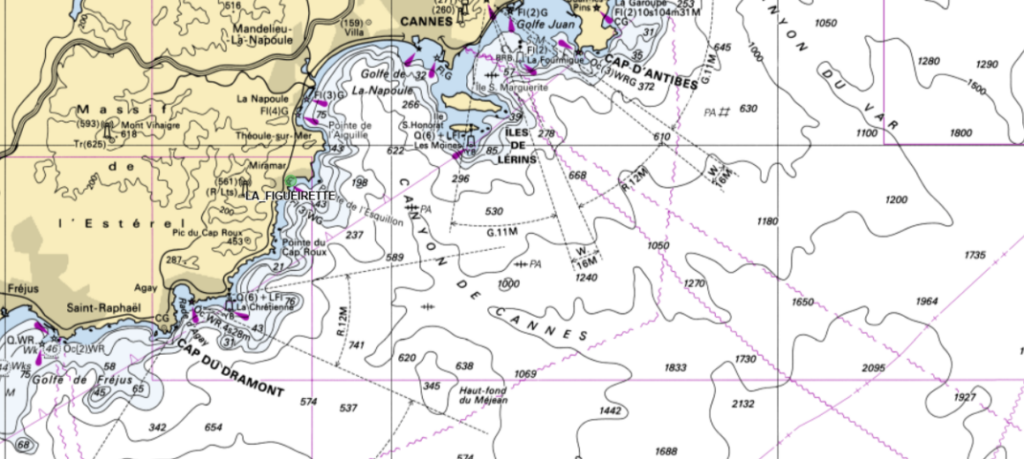
Levels, probes and isobaths
Numbers on a nautical chart indicate depths and altitudes.
It’s essential to distinguish between water-covered probes and rocks uncovered at low tide.
Isobaths are lines connecting points of the same depth.
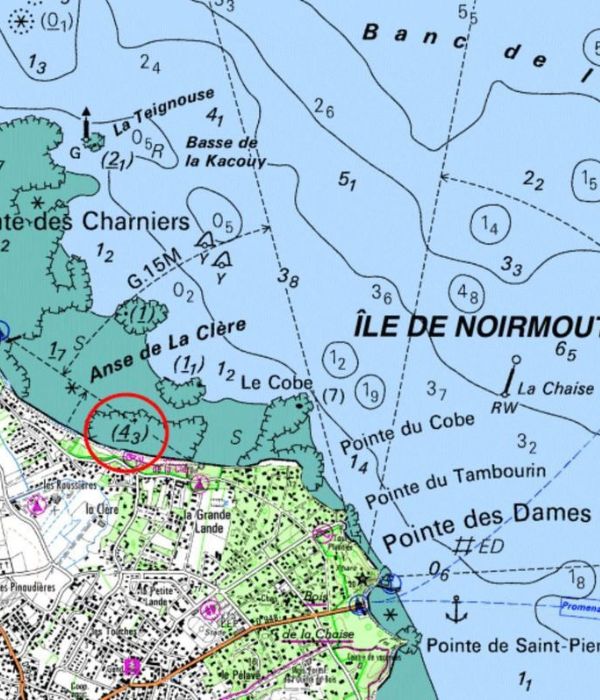
Figures on nautical charts
A tilted figure indicates the depth of the water, even when the sea is at its lowest.
For example, a “9” means 9 meters deep.
If the figure is underlined, it means a rock protruding from the water when the sea is low.
And if the number is in brackets, it’s just to make the map easier to see, as the exact point isn’t quite where the number is written.
The brown numbers indicate the height of a mountain or hill on the earth.